Since adding Drift to my blog I’ve been able to get real-time feedback from you, my readers, on what scripts you’d like to see on future posts. This script was requested by a rader last weekend and I’m sure anyone using Rubrik will find it useful.
The request was for monitoring the status of a Rubrik cluster and nodes using PowerShell and Rubrik REST APIs. Being a masterless, scale-out backup cluster, means that Rubrik can lose any 2 disks, 1 node, or even a whole brik without issue (when you have 3+ brik cluster). You’ll still have the interface, data, backups continue to run on the remaining nodes, and the ability to recover, so it’s resilient to the inevitable random failure of any hardware.

However, this doesn’t mean that you don’t want to be alerted to issues, as you need to replace that failed disk or node, and checking this manually seems a little archaic. This is where my example script comes in.
Using PowerShell, I first perform a Test-Connection (ping) on a list of Rubrik nodes to find one that is active. We could leave it at that, but just responding to a ping doesn’t mean the node or cluster is healthy. This neat little trick also ensures we aren’t going to try query a dead node for cluster status or declare the whole cluster dead because of a single node outage.
To get what we really need the next step is to authenticate with the Rubrik REST APIs, programmatically query the status of the cluster, nodes, disks, and use this to determine the overall health. This makes the script itself resilient to node failure, while also giving you a programmatic view of what you see on the Rubrik dashboard for health. Using this data, you can then make decisions and do whatever you want! To get you started, download the example script below:
RubrikNodeMonitoringv1.zip (Updated for CDM 5.0)
Extract it to “C:\RubrikNodeMonitoringv1”, configure the variables at the start of the .ps1 script with your cluster information and then run it. The first time you will be prompted to store your Rubrik credentials securely for subsequent runs, but thereafter it will be headless. It was written for and tested on Rubrik CDM 4.1-p3-2185 and you will see the following reports produced:
Cluster Status:
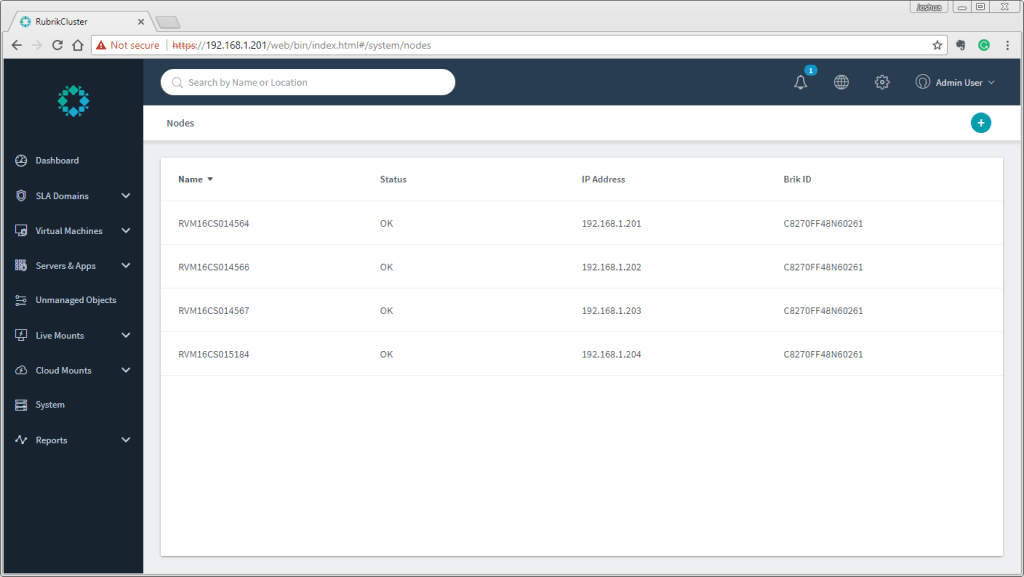
Node Status:
Disk Status:
You can easily then output these results with Export-CSV, save them to a SQL DB with examples here, or send an email using Send-MailMessage. In all 3 of these reports, you can see I have a healthy Rubrik cluster, but I can’t give you this script in good conscience and not actually test a failure! So, here is me pulling the 10GbE data/mgmt and 1GbE IPMI connections from one of the nodes in my Rubrik cluster:

Running the script again we see a much different output:
Cluster Status: Node Status:
And here is the Rubrik dashboard telling us the same issue:
After an hour I reconnected my node, the cluster self-healed, and the script started reporting the cluster/nodes as healthy again. The script also allows you to monitor cluster storage usage, cloud usage, and several other useful metrics.
If you like this script, then tweet me @joshuastenhouse or send me a message via the Drift chatbot. Happy scripting,
Joshua


Leave a comment